
Home renovation activity remained steady in 2025, with more than half of U.S. homeowners (54%) undertaking renovation projects, according to Houzz Inc., the leading AI-driven all-in-one software platform for construction and design. The 2026 U.S. Houzz & Home Study found that median renovation spend held at $20,000 in 2025, while high-end activity gained momentum, with the top 10% of projects reaching $150,000 or more (up from $140,000 the year prior).
Meanwhile, homeowners are taking a more measured approach to future projects, with 50% planning renovations (down from 52% last year) and intended median spend declining to $15,000 for 2026 from $20,000 in 2025.
“Home renovation continues at historic levels, even as homeowners take a more cautious approach to future projects,” said Marine Sargsyan, head of economic research at Houzz. “What’s driving this resilience is pent-up demand from homeowners who are finally able to act on long-planned renovations. At the same time, we’re seeing a clear shift toward investing in forever homes rather than moving, with many adapting their spaces to meet changing needs.”
Pent-up demand remains the strongest motivator for home upgrades, with 40% of homeowners saying they finally have the time to renovate and 36% reporting they now have the financial means to do so. One in 5 renovations is driven by a recent home purchase (20%) or damage due to home age (19%), while life events account for another 16%.

Among those updating due to life events, homeowners most often cite health or accessibility needs (21%), increased remote work (21%) and income or employment changes (20%), followed by a child moving out (19%). The survey also found that homeowners are adapting their existing spaces to meet these evolving needs rather than relocating, with nearly two-thirds of homeowners (61%) planning to stay in their homes for 11 years or more and 44% describing their residence as a forever home.
Gen Z Insights
Gen Z homeowners now account for 0.5% of renovators, up from 0.2% the year prior, representing a growing share of the overall market. They are significantly more likely to renovate following a recent home purchase (61%) compared with millennials (31%), Gen X (19%) and baby boomers (18%). Life changes also play a role, with one-third (33%) undertaking renovations due to shifts in family or daily life, while 22% address home damage.
The majority of Gen Z homeowners tackle interior room remodels (76%), the highest share of any generation, followed by home system upgrades (69%). Similar to other generations, kitchens are a leading priority (35%), though Gen Z homeowners are more likely than older generations to take on smaller spaces, particularly laundry rooms (33% versus 14% of millennials and Gen X) and closets (24% versus 17% of millennials).
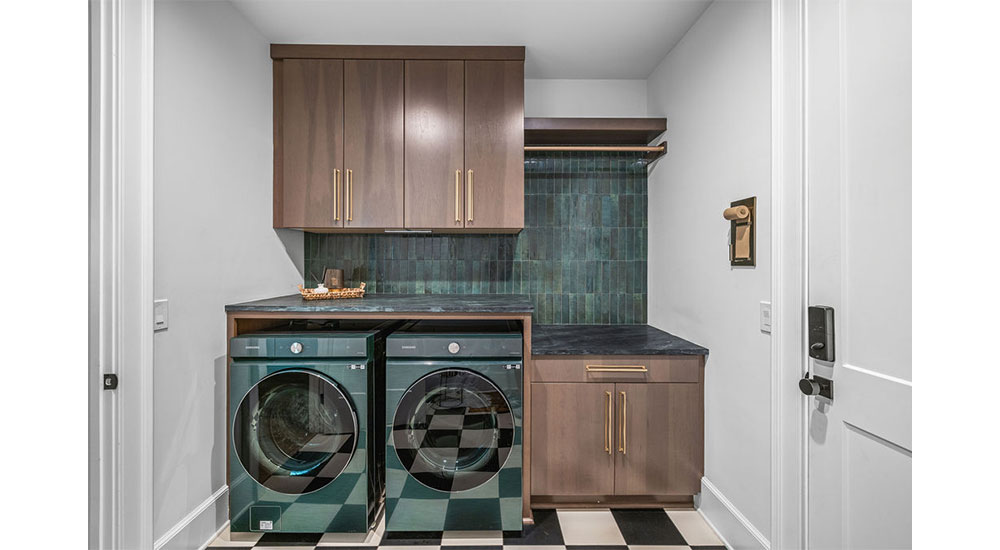
Image credit: Design by Boyce Design + Build; Photography by Norton Aerial Media, LLC
“Gen Z is carving out a growing share of the renovation market, driven in large part by their foray into homeownership and the immediate need to address functional upgrades,” said Sargsyan.
Older Homeowners Drive Highest Investment Levels
Seniors lead in median renovation spend at $25,000, while Gen X homeowners have now outpaced Baby Boomers, with a median spend of $24,000 compared with $22,000. At the high end, both Gen X and baby boomer projects reach $150,000 at the 90th percentile, underscoring the significant investment among these groups. This trend is especially evident in kitchen remodels, where spending rises steadily by generation and peaks among seniors at $27,500, nearly doubling from $15,000 the year prior and marking the largest year-over-year increase of any group.
In contrast, younger homeowners spend less overall, with Gen Z reporting a median of $8,500 compared with $15,000 for millennials. However, high-end activity differs sharply between the two groups, while the top 10% of Gen Z projects reach $52,000, millennial projects climb as high as $115,000. Gen Z homeowners are also more likely to rely on a broader mix of funding sources beyond savings (82%), including credit cards (34%) and tax refunds (14%), with tax refund usage significantly higher than among older generations.
Homeowners Turn to Credit Cards as Financing Mix Evolves
While the majority of homeowners continue to rely on savings to fund renovations (84%), credit cards are used by more than a third of homeowners (34%), up 5 percentage points year over year. Overall, the amount of funding sources is more diversified for those spending more than $50,000, with more homeowners borrowing against home equity (23%) and leveraging home sale proceeds (20%).
Despite three-quarters of homeowners setting initial budgets (75%), nearly 2 in 5 (37%) exceeded those plans in 2025, slightly outpacing those who came in on target (35%). While costlier than expected products or services (52%) remains a key factor, many homeowners are choosing to invest beyond their original plans by selecting higher-end materials (35%) or expanding the scope of their projects mid-renovation (31%).
High Reliance on Professionals Reflects Project Complexity
The vast majority of renovating homeowners (91%) hire professionals to complete their projects, reinforcing the essential role of industry experts in delivering complex renovations and the need for tools that support project coordination and transparency. General contractors continue to be the most frequently sought construction professionals, engaged by 29% of renovating homeowners. Design-build firms account for a smaller share of hiring, at 5%, but inched up by 2 percentage points year-over-year. As core systems remain a focus, specialty service providers are hired by homeowners, including electricians (41%), air conditioning and heating specialists (40%) and plumbers (36%).
Planning Surpasses Construction Timelines
Renovation projects take several months from idea to completion, with planning often exceeding the time spent on construction. Kitchen projects have the longest timeline overall, with an average of 9.5 months spent on planning and 5.8 months spent on construction. Even smaller-scale projects follow a similar pattern. Closets and home offices, for example, take 6.6 and 6.1 months on average to plan, respectively, and have construction phases that last 4.3 and 3.4 months on average, respectively.
Home Improvement Purchases Remain Steady Despite Select Declines
Home improvement purchasing activity remains consistent across most categories, even as a few areas see modest year-over-year declines. Paint (62%) continues to be the most commonly purchased category, followed by lighting fixtures (48%) and faucets and shower heads (46%). Building materials (41%) and lawn and garden supplies (44%) also rank highly, while select categories such as major kitchen appliances (29%, down from 33%) and noncarpet flooring (34%, down from 38%) have seen slight declines.
The Houzz & Home Study
The annual U.S. Houzz & Home Study is the largest survey of residential remodeling, building and decorating activity published. The survey covers a wide range of renovation projects in 2025, from interior remodels and additions to home systems, exterior upgrades and outdoor projects. Data gathered includes historical and planned spends, professional involvement, motivations and challenges behind building, renovation and decorating projects, as well as planned activities for 2026. The 2026 study includes more than 20,000 respondents in the U.S. alone, providing insights into the home improvement activity of the millions of users of the Houzz site and mobile apps.
The 2026 U.S. Houzz & Home survey was sent to registered users of Houzz and fielded between January and March 2026.
The full report is available here.


